 11
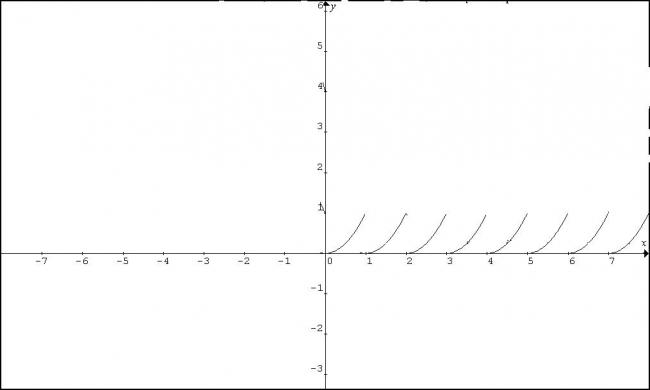
11Draw y = x2 ,then select the region between 0<x<1...repeat for other values of x..
-------------------------------------------------------------------------------------------
 1
1is the answer for (2) [sin B/2][/2]
1
raju07 subramanyam
·2010-04-08 04:40:31
oops..sorry not experienced in this..its sin square
 1
1@SANDIPAN
what u have drawn is the graph of [x]^2
The graph of [x^2] will be quite different...
we have to divide the domain into parts {(0→1),(1→√2),(√2→√3)and so on....
11
SANDIPAN CHAKRABORTY
·2010-04-08 07:00:24
ya sorry...
@JAKE ya i had read it wrongly but i think that , that was not for [x] but that was for f({x}) whereas we require the graph of {f(x)}...
To trnsform the graph of f(x) to {f(x)} we follow these...
1)draw lines y=1,y=2,y=3.....
2)transfer the portion of the fraph between two consecutive lines in the interval 0 ≤ y < 1...exclude points lying on y=1
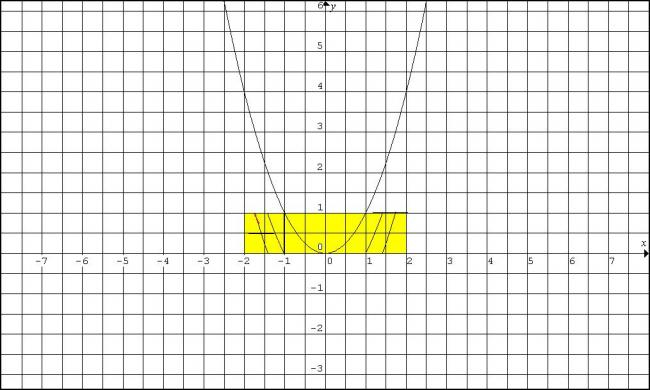
(in the graph the lines in the yellow region is the required graph....)
in this draw graph of y=x2 and draw the lines for y=1,y=2........
shift the graph between two lines in the interval 0 ≤ y < 1
in other words we are dividing the domain in the intervals into parts (0,1);(1,√2);(√2,√3).....as Jake said..
1
Zuko Alone
·2010-04-08 09:47:43
maximum value is 1+cos\beta