 1
1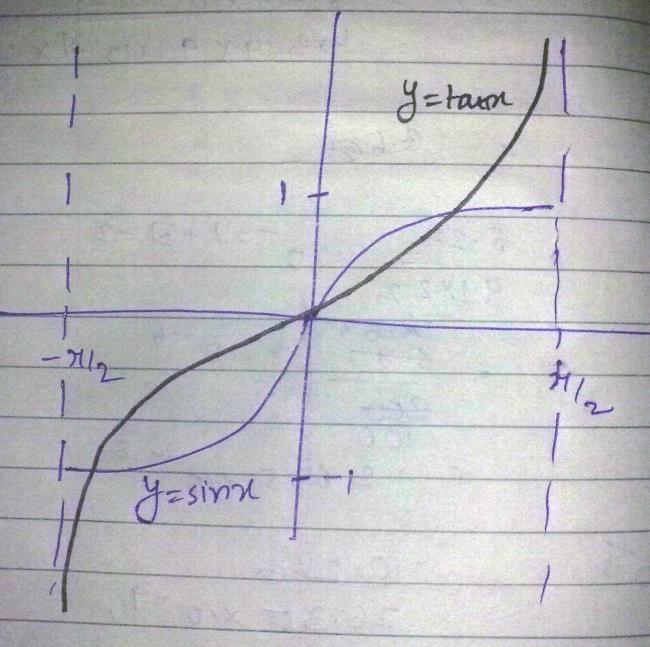
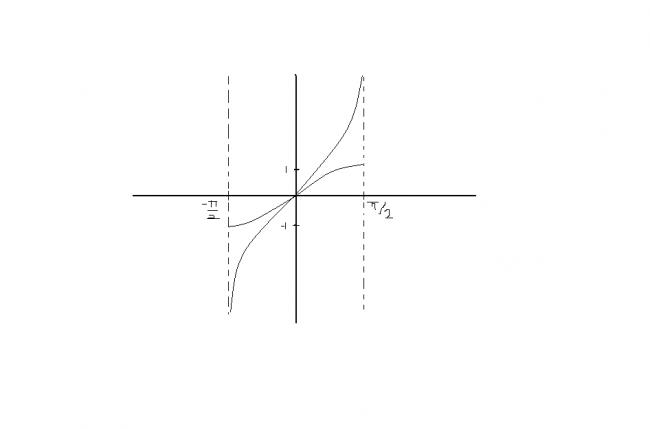
Draw the graph of Sin x and tan x between -pi/2 to pi/2 on the same sheet.
* I am trying to post some very simple graphs for some new users who may not know the basics and I expect them to answer (some of the older/ more advanced members may ignore these)
 62
62this is exactly the mistake everyone makes..
Keep in mind that the graphs dont intersect..
someone who can make it better?
62That is correct.. but can someone explain this behavior better?
In the sense that why these two graphs do not intersect in between except at zero?
 11
11method one :
tanx = sinxcosx
-->for x ε [o,π2]
0≤cosx≤1 , so tanx >sinx
-->for x ε [-π2,0]
again , 0≤cosx≤1 ,
but this time the numerator (sinx) is -ve so tanx has bigger -ve value than sinx
so ,
tanx < sinx
method two:
d(tanx)dx = sec2x
d(sinx)dx = cosx
for any value of x in interval [-Ï€2,0]
cosx < sec2x
so slope of 'tanx' curve > than slope of 'sinx' curve
similarly,
for any value of x in interval [o,Ï€2]
again ,cosx < sec2
so slope (tanx) > slope (sinx)
 1
1As far as my reasoning is concerned .. I will firmly go with Vaibhav.
62no qwerty I would infact say that your logic is far simpler than the given after you ;)