 1
1NOW MY DOUBT.... :P
wen i am already taking [x],,, y should i consider x=0.1, 0.5, 0.75 etc... ???????????? all of these will boil down to [x]=0..... plz explain.... :(
 62
62because: (answer this correctly u will know why!)
When [x]=0 .. what is x?
 1
1NOW MY DOUBT.... :P
wen i am already taking [x],,, y should i consider x=0.1, 0.5, 0.75 etc... ???????????? all of these will boil down to [x]=0..... plz explain.... :(
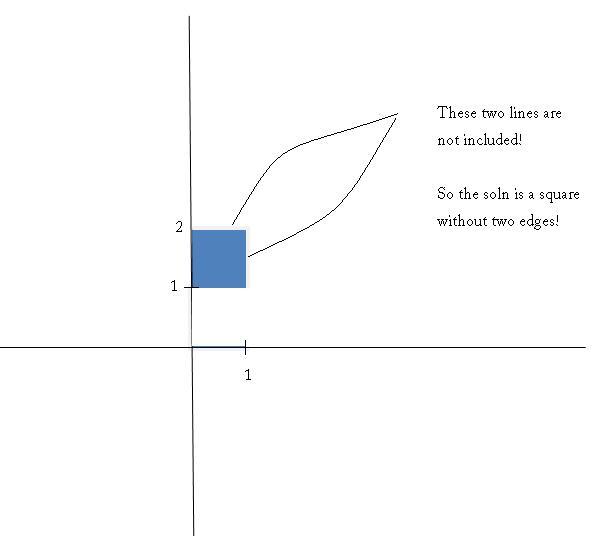
62[x]=0 means it covers all points x=[0,1)
also for each x(in the above interval),......... y takes values such that [y]=1 so y=[1,2)
So, for x=0, y=[1,2)
for x=0.1, y=[1,2) (so this will be a line above x=0.1
similarly for x=0.5, y=[1,2) (so this will be a line above x=0.5
for x=0.75, y=[1,2) (so this will be a line above x=0.75
(So, we have these red lines as shown!) for x=0.1, 0.5 and 0.75
now this will go for all x between 0 and 1
if we make the red lines for all the x's the whole blue region will get covered.
Now u need to tell me why we dont include the two lines x=1 and y=2?? (That part i leave for u to understand .. an easy on though )
62The solution of this problem is a bit tricky!
The first thing to note is that the LHS is an integer.
RHS = e[x]
so this will take values e-4,e-3, e-2, e-1, e0, e1, e2, e3, e4....... so on..
So, for this to be equal to LHS it has to be an integer.
The only way this can be an integer is when [x]=0 or e0 so LHS =1
so we know that [x]=0. Also, we know that [y]=1 (by substituting [x]=0 in the above equation!)
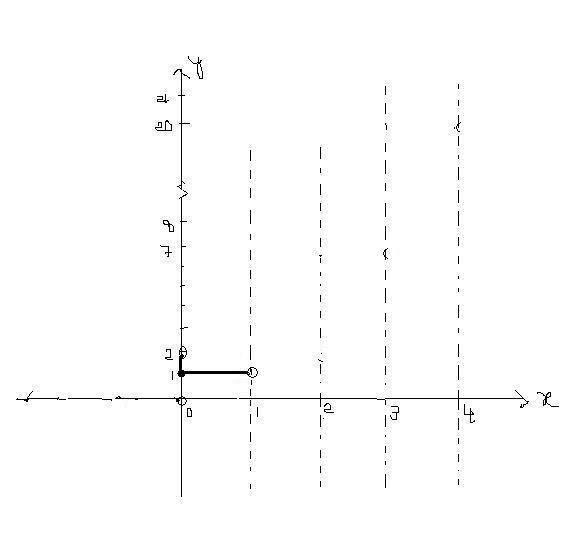
So we need to draw the equation of [y]=1 when [x]=0
The above graph is the representation of that part!
I will try to explain how this is the graph of [y]=1 when [x]=0!
 1
1I did not carefully read abhishek's answer. now as I read it i see that he had mentioned that the abobe line segment is not a part of it.
1I got abhishek's point for 0≤x<1 [x]=0 so,[y]=e[x]1 and so at all these values of x y will lie b/w 1≤y<2. so the graph will be the whole sqare except the line x=1 but why will the line y=2 be included.
62@vaibhav
We dont have to plot
[y]=[e[x]].
But [y]=e[x]
The first graph will be relatively simpler!!!!!!!
 33
33its [y]=e[x]
so LHS is integer so RHS should be integer.....
got some hint from it.
Don't see the answer or u will be biassed.
1I didn't get abhishek. I got the graph of y=e[x] but I coudn't modify it to [y]=[e[x]]. please help.
33is the curve only a square having vertices (0,1)(1,1)(1,2)(0,2) above line segment of square not a pat of it....
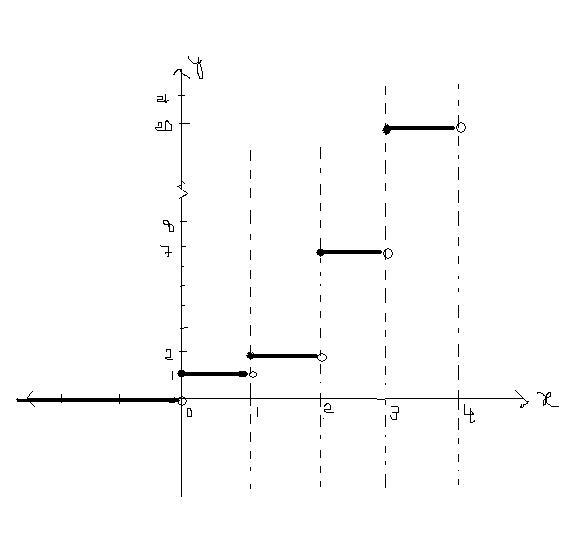
62first step is to find the graph of
y=e[x]
Then we will need to refine that graph suitably to reach the graph of
[y]=e[x]
 1
1do we need to find the graph of y=[x]
and y=e[x] and combine these two suitably
 1
1I can't see any graph. above ? only the fn y= [e[x]] have you hidden it , if yes how do we see it?
62No sky.. this is not the answer...
There are a "few" mistakes
This (The one sky has given!) is graph of y=[e[x]]