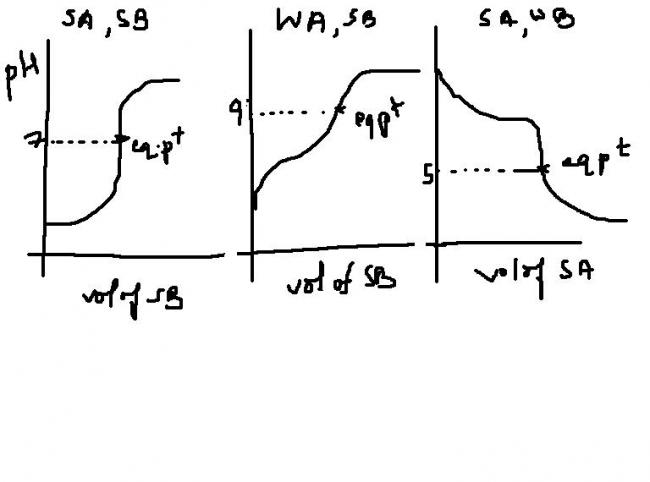
Draw curves for the following titrations.......
1)Strong acid-Strong base
2)Strong acid -Weak base
3)Weak acid -Strong base
-
UP 0 DOWN 0 2 1

1 Answers
 1
1HERE IS WHAT YUO WANT , GOT OT EBBING , HE GIVES A GOOD EXPLANATION .THE Y - AXIS REPRESENTS pH , X-AXIS THE VOL OF THE SUBS ADDED FROM THE BURETTE , I DON'T KNOW WHAT IT'S CALLED ,MAYBE TITRANT? SA- strong acid , WB weak base ,and so on.