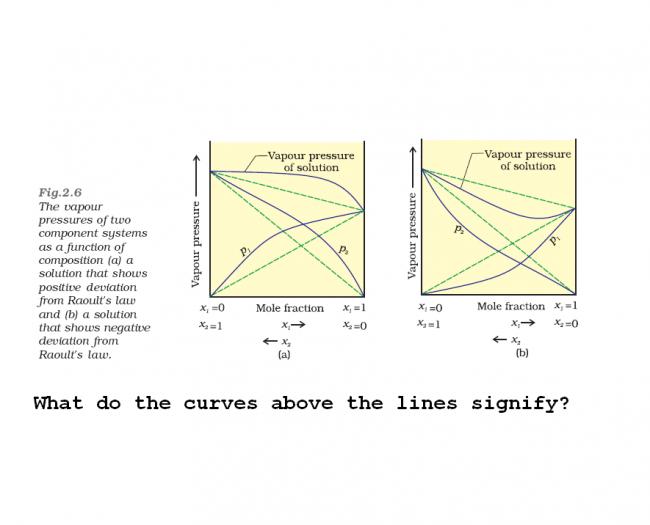
In 1886 the French chemist Francois Marie Raoult carried out a series of experiments to study the vapor pressure of a number of binary solutions containing non-volatile as well as volatile non electrolyte solutes. On the basis of the results of the experiment he stated a law known as Raoult's law.
It states that,
"In a solution of volatile components, the partial vapor pressure of a component at a given temperature is equal to the mole fraction of that component in the solution multiplied by the vapor pressure of that component in the pure state".
Now, let us consider a mixture of two completely miscible volatile liquids A and B, having the mole fraction xA and xB. Suppose at a given temperature their partial vapor pressures are pA and pB and the vapor pressure in pure state are:
raoults law
The total vapor pressure, P exerted by the solution is the sum of PA and PB as required by Dalton's law of partial pressures.
P = PA + PB
or P = p1x1+p2+x2
.................................(1)
in positive deviation
when x1=1,then x2=0..so P=p1, now as x1 decrease . x2 increases and this is positive deviation so P increases as according to (1)
at x=x2 ,x1=0 so P=p2
