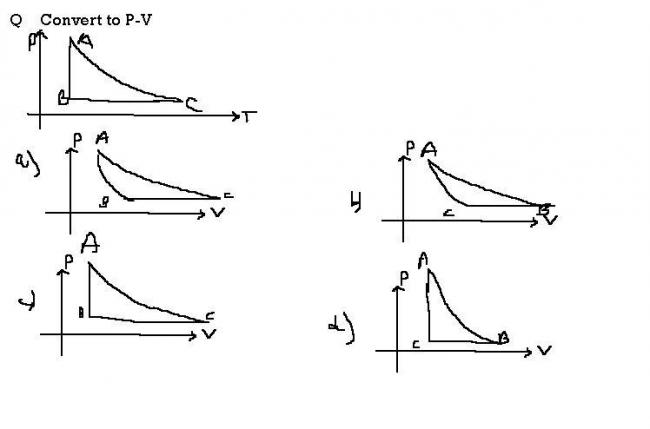
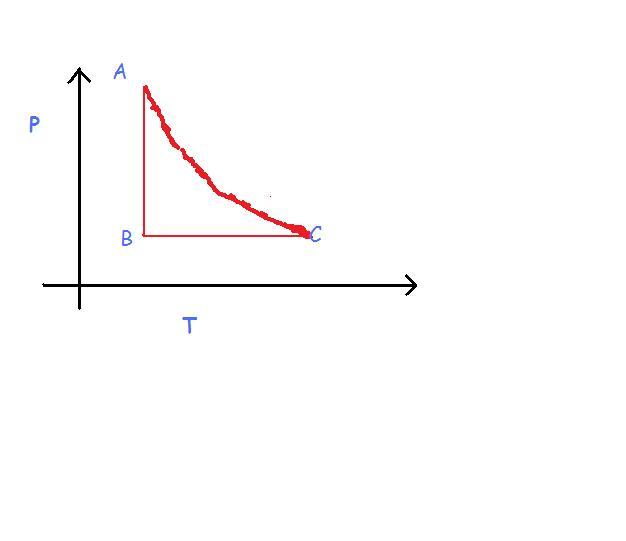
 1
1ok there is nothing as such feel that ans is none...
infact it really is none of these
i dunno if u know or not this was an iit screening 2003 q
and the question was declared wrong(no option matching) and the candidates were given bonus for this one.
 1
1um ok i think i misunderstood somewhere...
but how can i draw the correct PV graph without the correct PT graph ?
 24
24hey subho...that wa not for u.......
what i said was for my dear freind philip ....who i thought was walking on diff track as far as this ques is concerned..
its natural to have diff thought process..butleast we shhould know what other wants to convey..i was only trying to bridge the gap...
 49
49sorry eureka..
that was exactly the thing i wanted to do!! i.e. find out the correct P-V curve..
and that is why i tried to analyze the curve!!
but the question contradicted common sense!!
so i looked up at the above posts and it seems there somebody said that the question is wrong!!
i do not think it is wrong because the options do not match but i think it is wrong because they are not solvable according to me!! reason:look at my post!!
vol at C is at the same tiime coming to be greater than and less than volume at A
which in my opinion is absurd!!
had the results been like this: VA≤VC
and VA≥VC
we could have written the thing as VA=VC but this cannot be done here!![2][2][2][2]
what i am thinking is the plot A-C cannot be ADIABATIC reason: I DO NOT KNOW YET!! BUT I WILL TRY TO FIGURE OUT NOW!![2][2][2]
till then if someone can come up with a answer to the question, i would be the happiest person to learn from him kicking away all my wrong conceptions!!
and eurie we ARE on same tracks!![1][1]
24
eureka123
·2010-03-19 00:04:45
looks like we both are walking on diff roads ......
u r trying to prove ques wrong..which everyone knows...
and i am trying to form the correct PV graph from it
1
Philip Calvert
·2010-03-18 22:51:01
subho : i tried to tell him this two times.....
now you try...
49
Subhomoy Bakshi
·2010-03-18 12:13:45
so, now i will try to analyze the graph!![1][1]
the most problamatic one seems to be AC.
now if we look closely, the temperature of the system increases from A to C. Thus, internal energy increases. Thus work is done on system and system must have undergone adiabatic contraction...Thus volume must have decreased continuously from A to C.
thus volume at A>volume at C
in part A to B, pressure decreases at acnstant temp...so we get a rectangular hyperbola in the P-V graph as, P.V=const.
volume at B<vol at A
in the part B to C, temperature increases continuously from B to C and process is isobaric.
volume at C>volume at B
now the three conclusions do contradict each other
the first tells,
VOLA>VOLC
second and third tells,
VOLA<VOLC
so there is clear mistake in the question!!
24
eureka123
·2010-03-18 11:56:22
@che..
ya it is iit ques....and it was declared wrong......but more than that i want to know correct ans
24
eureka123
·2010-03-18 11:55:50
@philip..i did read ur full post...
u wrote "AC can never be adiabatic....".
but it is given in question that AC is adiabatic
1
Philip Calvert
·2010-03-18 09:19:02
@ Eureka : did you even care to read my full post...
If not then pls read it and point some error if any.
I just used PVγ = cons.
I dont think they defined adiabatic as something else in the question.
24
eureka123
·2010-03-17 11:34:50
i think none are correct.........
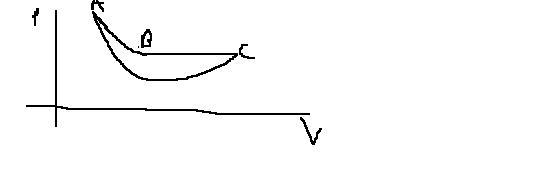
P.S. dont laugh too much at this strange graph..becoz i have already done so on everyones behalf [3][9]
24
eureka123
·2010-03-18 01:56:29
@govind...ya htat minima thing in my graph doesnt suit well.....but then how will the graph be ??????????????
24
eureka123
·2010-03-18 01:44:12
@philip,,,,it is given in ques that AC is adaibatic....
@everyone..
if u feel ans is none..atleast post ur graph....
1
Che
·2010-03-17 21:55:29
actually i guess i gave a rong reasoning for ans not to be B
BC is an isobaric procees and from B to C temp is increasing therefore volume shud also increase but in graph B from B to C volume is decreasing
So none correct
1
Philip Calvert
·2010-03-17 21:52:12
Hence in the question the point C should lie behind the point B
and hence the answer would be B.
Though you can freely hurl abuses if you like at the question framer.
1
Philip Calvert
·2010-03-17 21:49:48
you all are missing the point
P^{1-\gamma }T^\gamma = C \\\Rightarrow \frac{1-\gamma }{P}dP+\frac{\gamma }{T}dT = 0 \Rightarrow \frac{dP}{dT} > 0
AC can never be adiabatic....
1
Che
·2010-03-17 21:40:19
ok answer is none of these
@govind A can never be the ans bec AB is isothermal and AC is adiabatic and in graph A AB is shown steepr than AC
the more expected ans can be B but thats also not correct
in graph B at point A slope of graph of adiabatic curve is less than slope of grph of isothermal curve so that mean γ is leaas than 1 but we know γ is always gr8ter than 1
so option B is also ruled out
so none is correct
 29
29I think that the answer shud be A....the options given are correct..and the confusion whether the answer will be A or B can be cleared on this base..BC is a isobaric process so volume will increase with increasing temperature..so point B will have lower volume as compared to point C..hence i go with option A
@Eureka..in ur graph ..in that AC process can u tell me abt that point of minima..i mean the pressure decreases upto a point and then it increases ..why u thot like this.?
1
Che
·2010-03-17 21:03:27
no ans will be B
AC is adiabatic and AB IS isothermal
and since in grabh B AC is more steeper than AB
so that shud be correct
24
eureka123
·2010-03-17 21:03:24
thank god someone is taking intrest in thermo... [3]
@anirudh
in a)
AC which is adiabatic is above AB(isothermal) which is not possible..
 1
1hey bhaiya graph a) seems to be correct. what's the mistake in that one?